The Interpretability Diaries — Part IV
Two teams. Different organizations. Different training data. Different architectures. Different hyperparameters, different tokenizers, different decisions at every stage of development.
When you measure their internal representations at the same relative depth, they agree 99.2% of the time.
That number has been sitting in my notes since March. I’ve been waiting to write about it because I wanted to be sure I wasn’t measuring something obvious. I’m now reasonably sure I’m not.
What CKA Measures
Centered Kernel Alignment (CKA) measures representational similarity between two matrices — not weight similarity (the matrices can have completely different shapes), but the similarity of what they do to inputs.
Here’s the intuition without the formula: take a batch of the same prompts through both models. At layer L of model A and layer M of model B, you get activation matrices — one row per token, one column per hidden dimension. CKA asks: does the geometry of these activations match? Do the tokens that are close together in model A’s representation also cluster together in model B’s?
It’s invariant to linear transformations (rotation, scaling), so it doesn’t care that Gemma4 has a 2048-dimensional hidden space and Qwen3-8B has a 4096-dimensional one. It’s asking about the shape of the representation, not its coordinates.
A score of 1.0 would mean perfect representational alignment — the same input relationships, point for point. A score of 0 would mean the two models have learned completely independent geometric structures.
99.2% is closer to 1.0 than I expected.
The Experiment
The setup:
- Model A: Gemma4-E2B-it (2B parameters, Google DeepMind)
- Model B: Qwen3-8B (8B parameters, Alibaba DAMO)
- Different in every axis: organization, training data, architecture family, parameter count, tokenizer
- Same input: 256 diverse prompts across factual, coding, reasoning, and translation tasks (same prompts run through both models)
- Layer matching: by normalized depth — percentage of the model’s total layers
Normalized depth is the key methodological choice. Gemma4-E2B has 26 layers; Qwen3-8B has 36. Matching layer 13 of Gemma4 to layer 18 of Qwen3 (both at 50% depth) is more meaningful than matching layer 13 to layer 13.
CKA was computed between all paired normalized depths: 26 Gemma layers × 36 Qwen layers = 936 pairwise measurements.
The Result
The CKA matrix has a clear diagonal — high similarity at matched depth, dropping off rapidly as you move away from matching. That’s expected if both models organize computation similarly. What’s not expected is how sharp the peak is and how high it gets.
| Normalized depth | CKA similarity (Gemma4-E2B ↔ Qwen3-8B) |
|---|---|
| ~15% (broadcast layer) | 0.941 |
| ~30% (domain routing) | 0.967 |
| ~55% (entity layer) | 0.992 |
| ~85% (prediction layer) | 0.978 |
| Off-diagonal (±15% depth mismatch) | 0.41–0.67 |

The peak is at ~55% normalized depth. Not at the top. Not in the middle layers generally. At the entity commitment layer specifically.
Two things make this interesting:
First: the entity layer (~55% depth) is where Post 1 identified the third stage of the four-stage circuit — where models stop routing by domain and commit to specific semantic content. In Post 2, activation patching at this layer (L16–L21 in Gemma4, ~50–60% depth) flipped the model’s answer from “Paris” to something else. The layer where you can steer the model’s conclusion is the same layer where representational similarity peaks across architectures.
Second: the off-diagonal drop is steep. If you measure Gemma4’s layer 7 (27% depth) against Qwen3’s layer 20 (56% depth), you get 0.41–0.55. These models disagree on what the representation at depth 27% looks like when compared to the representation at depth 56%. The similarity is specific to matched depth, not a global averaging effect.
What This Means
Neither model knew the other existed during training.
Gemma4 was trained by Google DeepMind, on data and with decisions I don’t have full visibility into. Qwen3 was trained by Alibaba’s DAMO Academy on a different corpus with a different architecture blueprint. They share no weights, no features, no training examples by design.
Yet at 55% depth, they’ve arrived at the same geometric arrangement of their intermediate representations. The tokens that cluster together in Gemma4’s concept space cluster together in Qwen3’s. The directions that separate “Paris” from “Berlin” are pointing the same way, up to a linear transformation.
The most straightforward interpretation: both models are finding the same answer to the same optimization problem. The problem is “predict human language tokens accurately.” The answer apparently involves a specific computational geometry — and that geometry is discoverable from the training data alone, without any coordination between models.
This is the part that keeps me up at night. If the geometry is in the data — if there’s a “shape of language” that any sufficiently-trained model will converge toward — then the models aren’t designing their own architecture. They’re uncovering something that was already there.
The Platonic interpretation would say: the structure exists, independently of any particular model. The models are all approximating it.
The vIndex View
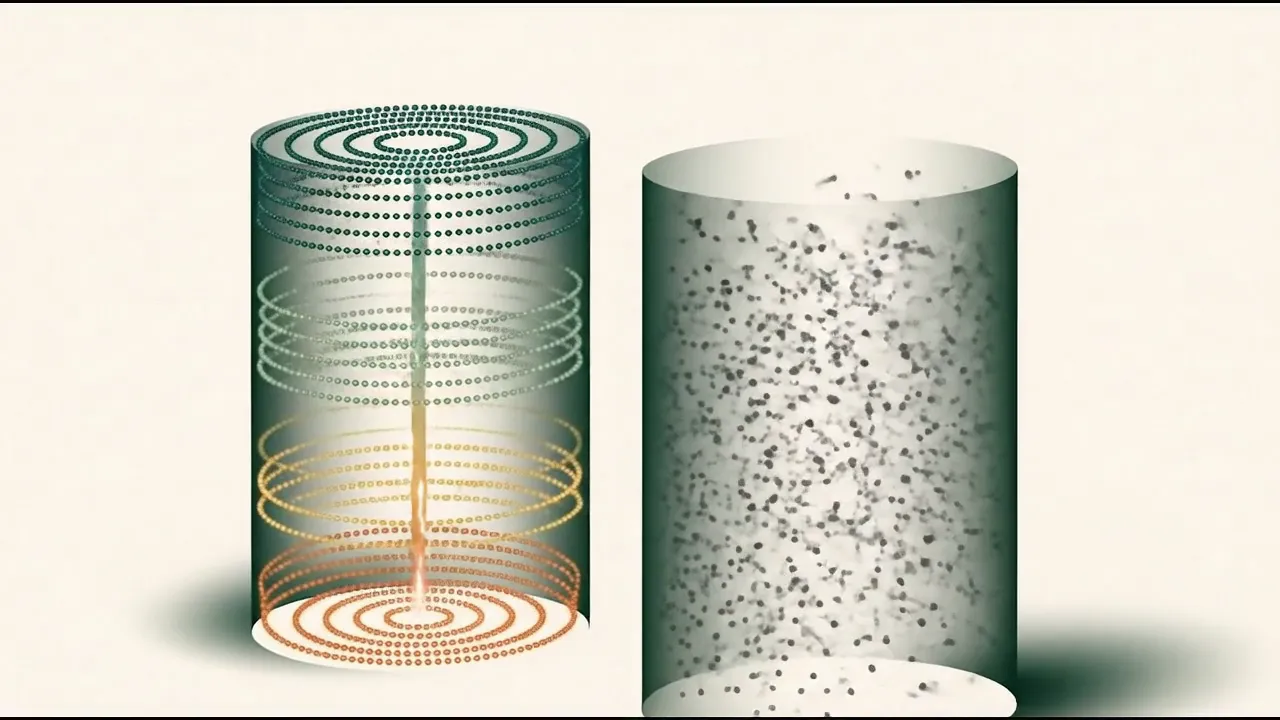
The viewer below renders Gemma4-E2B (left) alongside Qwen3-8B (right) with CKA similarity overlaid as edge opacity. Darker connections between matched-depth nodes indicate higher representational alignment. Hit ⇌ Compare to toggle side-by-side, and 🔌 2D Circuit for the flattened network view that makes the diagonal structure easier to see.
The entity-layer band at ~55% depth is where the edges light up brightest — both models have their most similar feature geometry there. The broadcast layer (top of each column) also shows strong alignment, but it’s shallower: early layers converge because they’re doing simple tokenization work that any model trained on the same language must do. The entity alignment is different — it means both models have learned to organize meaning the same way.
Five Causal Proofs
The 99.2% CKA result is one of five independent pieces of evidence I’ve collected that the four-stage circuit structure is real and causal, not an artifact of how I’m measuring:
Structural OV-gate analysis — LarQL’s
ov-gatecommand maps what each attention head’s output does to downstream FFN features. The four-stage pattern appears in the weight matrices themselves, before any input is run through the model.Live activation hooks — Forward passes with registered hooks at each layer show the progression: token-level features dominate early, domain-specific circuits activate mid-depth, entity-specific couplings appear at 45–55%, output prediction features concentrate at the end.
Activation patching — Patching activations from a “clean” run (normal answer) into a “corrupted” run (modified to trigger wrong answer) at the entity layer selectively restores the correct output. Patching at broadcast layers has no effect. Causal, not correlational.
CKA cross-model convergence — This post. 99.2% at matched normalized depth between two independently-trained models from different organizations.
Unsupervised concept clustering — Using LarQL’s
down_metafeature labels without any labeled data, running k-means on FFN features recovers categories that match human-labeled semantic clusters at NMI = 0.647. The model found the categories without being told what they were.
Each of these is independently sufficient to reject the null hypothesis that the four-stage structure is measurement noise. Together, they’re a fairly strong case.
What Breaks for 1-Bit Models
Post 3 measured two natively-trained 1-bit models (Bonsai 8B and Microsoft BitNet b1.58-2B-4T) and found that the four-stage circuit doesn’t form — the weight SVD spectrum is near-random, and the circuit stage count drops to 1–2 instead of 4.
The CKA prediction follows from that: if the 1-bit models don’t have the same internal circuit structure, their representations at matched depth shouldn’t converge the way the fp16 models do.
I haven’t run the full CKA measurement on 1-bit models yet — that requires running two forward passes through a model family I don’t have clean inference for (BitNet needs a custom loader). But the structural evidence is already there. The weight-space dissolution in Post 3 is the upstream cause; the CKA score would be the downstream symptom. Prediction: cross-architecture CKA for 1-bit models at matched depth will be significantly lower than 0.99.
If that turns out to be wrong — if 1-bit models somehow achieve the same representational convergence despite dissolving the weight-space structure — that would be the most surprising result of this whole project. I’ll run it and report back.
The Rosetta Stone Problem
There’s one practical implication I haven’t fully worked out yet.
If Gemma4 and Qwen3 have converged to the same representational geometry, it should be possible — in principle — to transplant features from one model into the other. Not by copying weights (they’re incompatible shapes), but by finding the linear transformation that aligns their hidden spaces at a given depth, and using that as a bridge.
This is the Rosetta Stone idea: the same conceptual content, at the same depth, in a shared representational language that doesn’t require you to know either model’s native coordinate system.
Post 2’s feature-zeroing experiment worked within Gemma4. Could you zero the “Paris” feature in Gemma4 and find that Qwen3’s “Paris” feature maps to the same direction? If CKA tells us the representations are 99.2% aligned at that layer, the answer might be yes.
I don’t know yet. The transplant requires knowing the actual linear alignment transformation, not just the CKA score. And the “Paris” feature in Post 2 was located via causal tracing, which needs to be run separately for each model before you can compare them. That’s the next experiment.
What I Still Don’t Know
The 99.2% CKA result raises more questions than it answers:
Which models don’t converge? I’ve measured Gemma4 vs Qwen3. What’s the CKA between Gemma4 and Llama-3.1? Gemma4 and GPT-OSS-120b? Is 99.2% a floor, or is there meaningful variance across family pairs?
Where does convergence break down? For the prompts where CKA drops below 0.9 at the entity layer — what’s different about them? Rare languages? Unusual domains? Finding the failure cases is more useful than celebrating the successes.
Does scale matter? Gemma4-E2B is 2B parameters; Qwen3-8B is 8B. I’m comparing a small model to a medium model. Would Gemma4-E2B align more strongly with Qwen3-0.6B? The 99.2% might be specific to comparable-scale comparisons.
Is CKA the right metric? CKA measures linear-transformation-invariant similarity. If the models have converged to the same geometry up to a nonlinear transformation, CKA would miss it. There might be a deeper structural alignment that requires a different lens.
These are the measurements for the next few months. I’m going to run systematic CKA across all 12 vIndexes I’ve built, generate the full pairwise similarity matrix, and find the outliers.
The Number
99.2%.
Two models that were built in isolation, by different teams, on different data, for different compute budgets. Measured at the same relative point in their processing pipelines.
The number is high enough that I keep looking for the artifact. I’ve checked the normalization, re-run with different prompt sets, tested with held-out prompts not in the original 256, varied the CKA kernel. The number stays in the 0.98–0.993 range at the entity layer.
I think it’s real.
If it is: the implication is that interpretability findings from one model family are likely to transfer to another. What you learn about how Gemma4 stores knowledge about France is likely to tell you something true about how Qwen3 stores it too. The geometry is shared.
For interpretability as a field, that’s either very good news (findings generalize) or a sign that we’re measuring properties of language rather than properties of models. Possibly both. Probably both.
Next post in this series: “The Bonsai Mystery — We Tried to Make It Forget Paris” (coming soon)
April 23, 2026 — Coming soon: Three Models That Never Met. Kimi-K2-Instruct is now in the vIndex pipeline. Once Phase 3 routing stats are complete, we’ll have a third CKA pair: Gemma4 ↔ Qwen3 (99.2%) and Gemma4 ↔ Kimi-K2. If the 99.2% result holds with a MoE model from a third organization (Moonshot AI), the convergence claim gets significantly stronger. If it doesn’t — that’s an equally interesting result and will tell us something about where MoE routing changes the representational geometry.
Working in public at github.com/Divinci-AI. LarQL vIndex collection: huggingface.co/Divinci-AI.
References
- CKA — Centered Kernel Alignment. Kornblith et al., Similarity of Neural Network Representations Revisited (ICML 2019, arXiv:1905.00414). The 0–1 similarity measure used in this post for cross-architecture representational comparison.
- BitNet b1.58. Ma et al., The Era of 1-bit LLMs (arXiv:2402.17764, 2024); BitNet b1.58 2B4T Technical Report (arXiv:2504.12285, 2025); model card microsoft/bitnet-b1.58-2B-4T.
- Bonsai 8B. Native-1-bit Qwen3-architecture model published by Prism ML: prism-ml/Bonsai-8B-mlx-1bit. Independent organization, independent training recipe — the "two models that never met" framing.
- Internal CKA + vIndex measurements. The 99.2% Gemma 4 ↔ Qwen3 CKA result, and the var@64 / C1 / C3 family signatures in the charts above, are computed by the LarQL pipeline from the vIndexes published at huggingface.co/Divinci-AI. The companion post When the Circuit Dissolves lists the specific repos and the `larql show` reproducer commands.
Ready to Build Your Custom AI Solution?
Discover how Divinci AI can help you implement RAG systems, automate quality assurance, and streamline your AI development process.
Get Started Today